Financial
forecasting is an essential part of all financial planning of a
corporation as it is the basis for budgeting activities and estimating
future financing needs of the company. Financial forecasting typically
involves forecasting sales and expenses incurred to generate those
sales. When making a financial forecast, directors typically use
an estimate of various expenses, sales & liabilities and the
most widely used method for making such projections is the percent-of-sales
method. In the percent of sales method, assets, liabilities &
total expenses are estimated as a percentage of sales that are then
compared with projected sales. These numbers are then used to design
a pro forma (panned or projected) balance sheet.
The steps necessary to compute a pro forma balance
sheet is as follows:
1. Express balance sheet items that vary directly
with sales as a percentage of sales. Any items that do not vary
directly with sales e.g. long term debt, retaining earnings, common
stock & property/plant/equipment are designated as not applicable
(n/a).
2. Multiply the percentages from step 1 by the sales
projected to obtain the amounts for future periods.
3. Where no percentage applies (e.g. for long term
debt, common stock or retained earnings numbers), take the figures
from the present balance sheet in the column for the future period.
4. Calculate the projected retained earnings using
the below formula:
Projected Retained Earnings = Present
retained earnings + Projected Net Income – Cash Dividends
Paid
5. Total up the assets account to obtain a total projected
assets number, then add projected liabilities & equity accounts
to determine the total shortfall. This shortfall indicates the total
external financing that is required to keep the company running
at present operational levels.
Example of Financial Forecasting Using Percent
of Sales Method
Let’s do a financial forecast for Bongo Corp.
for the year 2009 assuming net income is to be 10% of sales and
the dividend payout ratio is 5%. Also, projected sales are estimated
to be at $60 million (using an estimate of 2 x current assets).
The
forward market allows investors to trade forward contracts on currencies
on the global currencies markets. A forward contract is an agreement
between an organization and a commercial bank to exchange a specified
amount of one currency at a specified exchange rate (also known
as the forward rate) on a specified date in the future. Why would
a corporation ever need a forward contract? Consider a multinational
corporation operating in Finland anticipates a future receipt of
foreign currency such as the Chinese Yuan from a customer in China.
When such a need arises, the multinational corporation can lock
in the rate at which they purchase or sell a particular foreign
currency.
This is known as hedging a currency. Usually forward
contracts involve very large corporations expecting merchandise
from a foreign currency and expecting to pay the supplier in their
local currency. Therefore, a typical forward contract is valued
at a minimum of $1 million US. Thus, forward contracts are normally
not used by small corporations or individual investors. When a large
corporation goes to obtain a forward contract, and if the bank has
a doubt in its ability to make future payments, the bank could ask
for a small upfront deposit to ensure the corporation will be able
to repay. This type of a deposit is known as a compensating balance
and no interest is received on any sums deposited. Most common forward
contracts are for 30, 60, 90, 180 or 360 days.
How International Companies Use Forward Contracts
Multinational corporations use forward contracts to
hedge their expected imports. They can lock in the rate at which
they will be able to obtain a currency needed to purchase imports
from a foreign country. As an example, consider Mike Tee Corp. operating
out of Orlando, Florida will need $1,000,000 Australian dollars
to purchase their imports of raw materials. It can purchase Australian
dollars, at say $0.60 per Australian dollar. At this spot rate,
the firm would need:
Australian Dollars = $1,000,000
Spot rate = $0.60 per Aussie dollar
American funds needed = $1,000,000 Australian
x $0.60
American funds needed = $600,000 US
However, let’s assume the company does not have
$600,000 US to buy their imports now. The company can wait for 90
days and raise the cash needed, and exchange it to Australian dollars
at the spot rate available during that time. But we do not know
what the spot rate will be during that time. Say in 90 days, the
Australian dollar rises to $0.65 for every $1 US as a result of
the Aussie government increasing interest rates. When this happens,
Mike Tee Corp. will need additional funds to purchase the same $1miillion
Aussie dollars. Here are the calculations:
Australian Dollars = $1,000,000
Spot rate = $0.65 per Aussie dollar
American funds needed = $1,000,000 Australian
x $0.65
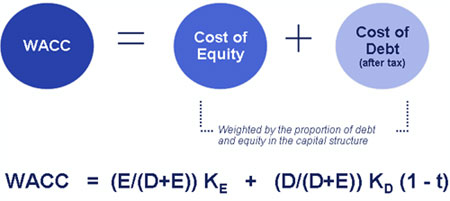
Weighted
Average Cost of Capital is a calculation of the overall cost of
capital used by a corporation and is an average representing the
total return (in percent) that is expected of an organization on
all its assets, debts and owner’s equity to maintain its current
stock price & valuations. Weighted Average Cost of Capital weighs
in all items that play a role in the corporation’s capital
structure including common and preferred shares, bonds, and other
long term debts.
In order to calculate the weighted average cost of
capital, we must first examine the capital structure of the company
we are analyzing. In terms of corporate finance, capital structure
refers to how a corporation finances it assets and its business
operations; either through the use of long term debt, common shares
or preferred stock (also known as shareholder’s equity) or
other hybrid securities. Weighted Average Cost of Capital becomes
especially important when the capital structure of a firm involves
both debt and equity financing. In this example, we will look at
the three most common types of financing included in capital structure:
i) Common shares equity
ii) Preferred shares equity
iii) Long term debt
Steps for Calculating Weighted Average Cost
of Capital
There are three steps for calculating the WACC of
an organization.
1) Determine the proportionate weighting
of each source of capital financing based on their market
value.
2) Calculate the after-tax rate of return
or cost of each source.
3) Calculate the weighted average cost
of all sources
The formula for WACC is:
WACC = (Ke x We) + (Kp x Wp) + Kd/pt
[1 – t] x Wd)
Ke =Cost of capital -common
equity
We =Percent of common equity
in the capital structure, at market value
Kp = Cost of preferred equity
(shares)
Wp =Percentage of preferred
equity in the capital structure (at market value)
Kd/pt =Cost of debt (pre-tax)
T = Tax rate
Wd=Percentage of debt in the
capital structure (at market value)
Sales to Accounts Payable = Sales / Accounts Payable
ii) Days’ Purchases in Accounts Payable
Days’ purchases in accounts payable = Accounts
Payable / (Purchases / 360 days)
Assume the following data derived from the Income statements &
Balance sheets of Juakali Corp. for its 2009 year.
2009 (Year 1)
2010 (Year 2)
Accounts Payable
$76,500
$71,300
Purchases
$900,000
$845,000
Sales
$2,100,000
$1,800,000
The relevant ratio calculations for each of the years
are:
2009 (Year 1)
2010 (Year 2)
Sales to Accounts
Payable
$2,100,000 / $76,500 = 27.45
$1,800,000 / $71,300 = 25.25
Days’ Purchases
in Accounts Payable
$76,500 / ($900,000 / 360)
= 30.60 days
$71,300 / ($845,000 / 360)
= 30.38 days
Notice that the sales to accounts payable ratio went
down from 27.45 in Year 1 (2009) to 25.25 in Year 2 (2010); an improvement
of 8%. This indicates the company’s improved ability in year
2 (2010) to obtain short term credit & financing in cost-free
funds. This ratio simply means the company is making more sales
and is lowering its accounts payable by a certain percentage, which
is good for investors & the outlook for the balance sheet. Below
we present the data in graphical format. (View
Full)
Dollar
Cost averaging is an investment mechanism in which stocks are purchased
at constant dollar amounts at regularly spaced intervals, with the
most amount of stocks bought at the lowest stock prices possible.
By investing a fixed amount of money each time, more shares are
bought at lower prices and fewer shares are bought at higher prices.
This approach results in a lower average cost per share because
the investors buy more shares of the same stock at the lower prices.
The formula for dollar cost averaging is: (View
Full)
Dollar Cost Averaging (Average Price)
= Total market price per share / Total number of Investments
Example
An investor invests $200,000 per month in IBM shares
and performs the following transactions:
Most
newbie investors are confused as to what convertible bonds are;
they wonder are they really bonds or convertible bonds that are
stocks, or both? Basically, convertible bonds are corporate bonds
(bonds issue by large organizations) that are convertible in to
the common stock of that issuing corporation. Convertible bonds
are when bondholders can exchange their bonds for a fixed number
of the issuing company’s common shares. Convertible bonds
allow bondholders the potential to increase their net worth by future
increases in the market value of the common shares of the issuing
company. If the share prices of the company do not increase and
the bonds are not converted, bondholders will continue to receive
periodic interest payments and their principal amounts upon maturity.
Bond Conversion Ratio
The bond conversion ratio is also known as the conversion
premium and ultimately determines how many shares can be converted
from each bond outstanding. This conversion can be expressed as
a ratio or as the conversion price. Usually the details regarding
this are stated in the bond’s agreement or indenture.
As an example, consider Jahmani Corp. offers bonds
with a conversion ratio of 32:1 for their bonds with a $1000 par
value. This means each bond outstanding (with a par value of $1,000)
can be exchanged for 32 shares of the issuing company’s common
shares.
Let’s consider a hypothetical bond conversion
example to clarify the conversion process & accounting rules.
Assume that Jahmani Corp. is issuing a new bond to the market with
a 6% coupon rate and 10 years to maturity. The company has other
10 year term debt that carries an 8% yield and the company’s
stock price is currently trading at $41. Here is a summary of this
data in tabular format
Annual
percentage rate (APR) is a true measure of the interest fees charged
by credit card companies & banks. Annual percentage rate (APR)
is the effective cost of credit which is the ratio of finance charges
to the average amount of credit used in the life of the loan; this
is expressed as a percentage per year. In this tutorial, we look
at the calculation of APR for single payment loans & multiple
instalment loans.
Single Payment Loans
A single payment loan is repaid in full on the maturity
date and there are two ways of calculating APR on single loan payments:
I) simple interest method and ii) the discount method. The difference
between the simple interest method & the discount method is
what the borrower actually receives in the form of a loan.
i) Simple Interest Method
Under the simple interest method, interest is calculated
on the full original amount borrowed. The formula for simple interest
is:
Simple interest = Principal x Rate x
Time = p x r x t
An
amortized loan is one that is paid off in equal periodic instalments
or payments and includes varying portions of principal & interest
during its term. Examples of amortizable loans include auto loans,
mortgages, business loans & others. How do you compute the periodic
payments on an amortized loan?
The formula is:
Amount
of loan = A = (P / PVIFA)
How to calculate the amount of loan:
1) Divide the principal loan amount (A) b PVIFA, which
is a factor shown in the Present Value Interest
Factor of Annuity of $1 table, and use this formula
The
acid-test or quick ratio is a variation of the current ratio that
divides current assets by current liabilities to arrive at an answer.
However, it is a stricter test of a company’s liquidity because
it factors in to account only the most liquid assets that a company
has including Cash, short term investments & accounts receivable.
Inventory is not included in the acid-test ratio calculation because
of the length of time needed to convert inventory to cash by making
sales. However, there may be some types of inventories such as groceries,
milk, eggs & meat that are more liquid than accounts receivable,
however according to accounting standards; they may not be included
in the acid-test ratio. Also, prepaid expenses are not included
in the acid-test ratio because they cannot be converted in to cash
and are not capable of covering current liabilities...

 Weighted
Average Cost of Capital is a calculation of the overall cost of
capital used by a corporation and is an average representing the
total return (in percent) that is expected of an organization on
all its assets, debts and owner’s equity to maintain its current
stock price & valuations. Weighted Average Cost of Capital weighs
in all items that play a role in the corporation’s capital
structure including common and preferred shares, bonds, and other
long term debts.
Weighted
Average Cost of Capital is a calculation of the overall cost of
capital used by a corporation and is an average representing the
total return (in percent) that is expected of an organization on
all its assets, debts and owner’s equity to maintain its current
stock price & valuations. Weighted Average Cost of Capital weighs
in all items that play a role in the corporation’s capital
structure including common and preferred shares, bonds, and other
long term debts. 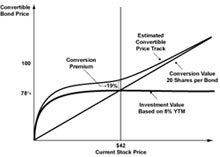 Most
newbie investors are confused as to what convertible bonds are;
they wonder are they really bonds or convertible bonds that are
stocks, or both? Basically, convertible bonds are corporate bonds
(bonds issue by large organizations) that are convertible in to
the common stock of that issuing corporation. Convertible bonds
are when bondholders can exchange their bonds for a fixed number
of the issuing company’s common shares. Convertible bonds
allow bondholders the potential to increase their net worth by future
increases in the market value of the common shares of the issuing
company. If the share prices of the company do not increase and
the bonds are not converted, bondholders will continue to receive
periodic interest payments and their principal amounts upon maturity.
Most
newbie investors are confused as to what convertible bonds are;
they wonder are they really bonds or convertible bonds that are
stocks, or both? Basically, convertible bonds are corporate bonds
(bonds issue by large organizations) that are convertible in to
the common stock of that issuing corporation. Convertible bonds
are when bondholders can exchange their bonds for a fixed number
of the issuing company’s common shares. Convertible bonds
allow bondholders the potential to increase their net worth by future
increases in the market value of the common shares of the issuing
company. If the share prices of the company do not increase and
the bonds are not converted, bondholders will continue to receive
periodic interest payments and their principal amounts upon maturity.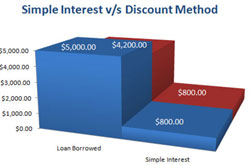 Annual
percentage rate (APR) is a true measure of the interest fees charged
by credit card companies & banks. Annual percentage rate (APR)
is the effective cost of credit which is the ratio of finance charges
to the average amount of credit used in the life of the loan; this
is expressed as a percentage per year. In this tutorial, we look
at the calculation of APR for single payment loans & multiple
instalment loans.
Annual
percentage rate (APR) is a true measure of the interest fees charged
by credit card companies & banks. Annual percentage rate (APR)
is the effective cost of credit which is the ratio of finance charges
to the average amount of credit used in the life of the loan; this
is expressed as a percentage per year. In this tutorial, we look
at the calculation of APR for single payment loans & multiple
instalment loans.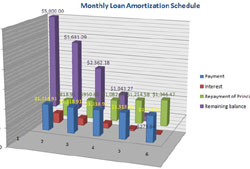 An
amortized loan is one that is paid off in equal periodic instalments
or payments and includes varying portions of principal & interest
during its term. Examples of amortizable loans include auto loans,
mortgages, business loans & others. How do you compute the periodic
payments on an amortized loan?
An
amortized loan is one that is paid off in equal periodic instalments
or payments and includes varying portions of principal & interest
during its term. Examples of amortizable loans include auto loans,
mortgages, business loans & others. How do you compute the periodic
payments on an amortized loan?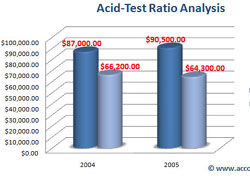 The
acid-test or quick ratio is a variation of the current ratio that
divides current assets by current liabilities to arrive at an answer.
However, it is a stricter test of a company’s liquidity because
it factors in to account only the most liquid assets that a company
has including Cash, short term investments & accounts receivable.
Inventory is not included in the acid-test ratio calculation because
of the length of time needed to convert inventory to cash by making
sales. However, there may be some types of inventories such as groceries,
milk, eggs & meat that are more liquid than accounts receivable,
however according to accounting standards; they may not be included
in the acid-test ratio. Also, prepaid expenses are not included
in the acid-test ratio because they cannot be converted in to cash
and are not capable of covering current liabilities...
The
acid-test or quick ratio is a variation of the current ratio that
divides current assets by current liabilities to arrive at an answer.
However, it is a stricter test of a company’s liquidity because
it factors in to account only the most liquid assets that a company
has including Cash, short term investments & accounts receivable.
Inventory is not included in the acid-test ratio calculation because
of the length of time needed to convert inventory to cash by making
sales. However, there may be some types of inventories such as groceries,
milk, eggs & meat that are more liquid than accounts receivable,
however according to accounting standards; they may not be included
in the acid-test ratio. Also, prepaid expenses are not included
in the acid-test ratio because they cannot be converted in to cash
and are not capable of covering current liabilities...