![]()
|
|
|
Chapter 1.5® - Units of Production Amortization Method, Effects on Net Book Value & Accumulated Amortization
If the capacity of capital assets used is almost the same every period, the best amortization method is straight-line amortization. However, if the usage of the capital asset varies significantly from one period to the next, the best method to use is the Units of Production amortization method. As an example, a real estate builder may use construction equipment one month, and thereafter not use it for many months. Thus, when use of the equipment varies from period to period, units of production amortization method is the best way to match revenues generated from the capital asset to the expense. Units of production method charges a varying amount to amortization expense each period; it is calculated in a 2 step process:
To illustrate the Units of Production amortization method, consider a similar scenario of BB company from the straight-line method. BB Company bought a high-end machine on January 1st, 2004 for $15,000 and used it throughout its predicted useful life of 5 years, through to December 31st, 2008; salvage value is $3000. The machine is expected to produce a total of 40,000 units of a particular beverage over its useful life. Here’s how the calculations would work out:
** Notice the total # of units is 40,000 which equals to the total useful life of the machine. *** Total amortization expense equals $12,000
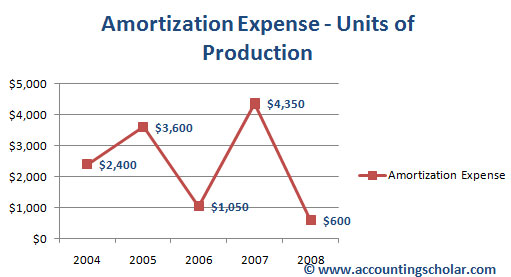
This above graph shows the amortization expense incurred in each year using the units of production amortization method. Notice how the amortization expense fluctuates each year thanks to the # of units actually produced (output) for that year. For instance, the total # of units (output) in 2004 was 8000 units while that number increased to 12,000 in 2005. This means amortization expense in 2004 ($2,400) was lower than the amortization expense in 2005 ($3,600).
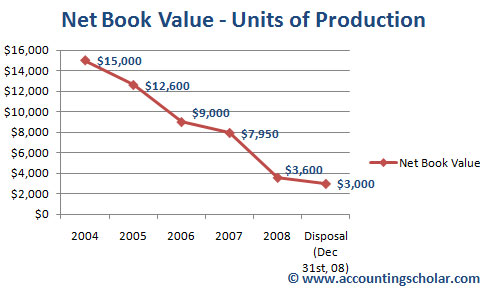
This above graph shows the decline in net book value of the capital asset using the units of production amortization method. This graph shows a steady decline in the net book value of the capital asset, which is a normal sign. Notice that on December 31st, 2008, we reach the disposal value of $3,000 after which the asset is expected to be sold or disposed off, thus the net book value calculation stops here.
|
© Accounting Scholar | Privacy Policy & Disclaimer | Contact Us |