Suppose you are offered an investment that will pay you
$200 in one year, $400 the next year, $600 the following year and $800
at the end of next year. You can earn 9% on such similar investments.
That being said, what is the most you would be willing to pay for this
investment? In other words, what is the present value of this investment?
Solution:
To solve this problem, we need to calculate the present
value of each of these cash flows at 9%. Let’s deal with each one,
one at a time:
Note: To solve this problem, we must use the present value discount factor
explained in the time value of money chapter.
Present
Value Discount Factor = $1 x [1/ (1 + r) t] = $1/ (1 + r) t
$200 x 1
/ 1.091 = $183.49
$400 x 1
/ 1.092 = $336.67
$600 x 1
/ 1.093 = $463.31
$800 x 1
/ 1.094 = $566.74
Total =
$183.49 + $336.67 + $463.31 + $566.74
Total =
$1,550.21
Below is the data summarized in tabular format and following
it is the data shown on a pretty little graph:
Year
Present
Value
Future
Cash Flows
1
$183
$200
2
$337
$400
3
$463
$600
4
$567
$800
Total:
$1,550
$2,000
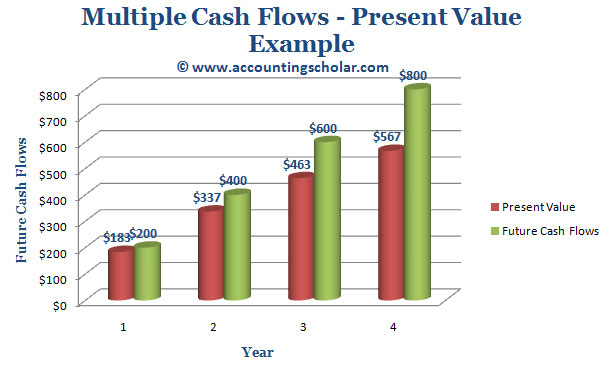
Notice from this graph that for instance if at the end of
Year 1 we receive a payment of $200 as cash flows, then the present value
or discounted value of that cash flow at the end of the year is $183.49.
Similarly, an investment that pays $400 at the end of the 2nd year is
discounted for present value at $337 now. We can perform these calculations
using our financial calculator, let’s actually do it to compare
our results.
This graph shows the breakdown of the annual
cash payments of $200 in the first year, $400 in the 2nd year, $600 in
the third and so on and breaks down the present values of each of these
cash flows in a graphical format.
i) Find Present Value of $200 at Year 1, 9%
rate of return.
N
=
1
I/Y =
9%
PV =
?
PMT =
$0
FV =
$200
2ND
I/Y
P/Y =
1
C/Y =
1
CPT & PV =
$183.49
ii) Find Present Value of $400 at Year 2, 9% rate of return.
N
=
2
I/Y =
9%
PV =
?
PMT =
$0
FV =
$400
2ND
I/Y
P/Y =
1
C/Y =
1
CPT & PV =
$336.67
iii) Find Present Value of $600 at Year 3, 9% rate of return.
N
=
3
I/Y =
9%
PV =
?
PMT =
$0
FV =
$600
2ND
I/Y
P/Y =
1
C/Y =
1
CPT & PV =
$463.31
iv) Find Present Value of $800 at Year 4, 9% rate of return.